Physical Address
304 North Cardinal St.
Dorchester Center, MA 02124
Physical Address
304 North Cardinal St.
Dorchester Center, MA 02124

When a visitor waits more than three seconds for a page to appear, the bounce rate can climb by as much as 32 %. On a typical Joomla site that receives 10 000 monthly visits, that translates into roughly 3 200 lost sessions. Each lost session reduces the chance of a conversion—whether it is a newsletter sign‑up, a product purchase, or a contact form submission. Studies show that a one‑second delay in page load can shave up to 7 % off conversion rates. For Joomla e‑commerce stores, that can mean thousands of dollars in revenue each month. In addition, Google’s Core Web Vitals now feed directly into the Quality Score used for ad placements, so slower pages can increase cost‑per‑click for paid campaigns. In short, performance is not a nice‑to‑have metric; it is a revenue driver that affects both organic and paid traffic.
Google treats page speed as a ranking signal for both desktop and mobile searches. The algorithm looks at the time it takes for the first byte (TTFB) and the overall load time of the visible content. A Joomla site that delivers its first byte in under 200 ms typically ranks higher than a comparable site that takes 500 ms. Mobile‑first indexing means the mobile version of a Joomla site is evaluated first, and mobile connections are often slower, making optimization even more critical. In addition, Google’s PageSpeed Insights assigns a score out of 100; sites scoring above 90 are considered “fast,” while scores below 50 trigger a warning in Search Console. The score is directly linked to the Core Web Vitals we discuss later. By keeping the total blocking time under 150 ms and the largest contentful paint (LCP) under 2.5 seconds, we can stay in the “good” range and avoid a ranking penalty.
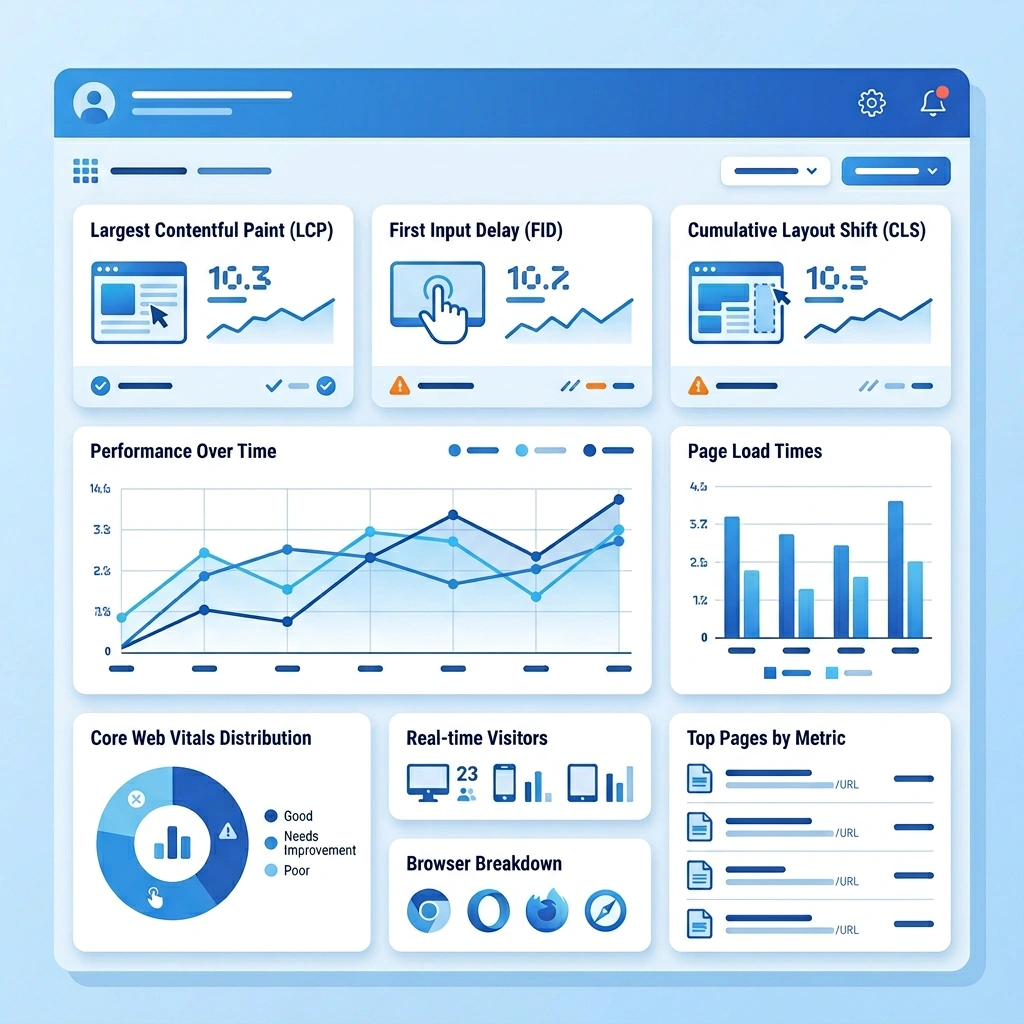
Core Web Vitals consist of three metrics that Google monitors continuously:
When we audit a Joomla installation, we look at the server response time, the size of the HTML payload, and the number of render‑blocking resources. Reducing the TTFB from 350 ms to 120 ms, compressing CSS/JS files, and deferring non‑critical scripts typically bring LCP down by 0.8 seconds and CLS close to zero. By targeting these three numbers, we align our Joomla site with Google’s performance expectations and protect our search visibility.

Joomla stores most of its dynamic content in a MySQL or MariaDB database. The core tables include #__content, #__categories, #__users, #__extensions, and #__session. By default, Joomla creates tables with the InnoDB engine, which offers row‑level locking and crash recovery. Some older extensions still use MyISAM, which can become a bottleneck under concurrent traffic because it locks entire tables on write. The #__session table grows quickly on high‑traffic sites; each visitor’s session record is a row that expires after the session timeout. The #__extensions table holds metadata for every installed plugin, module, and component; a bloated table can slow down the extension loading routine. Understanding which tables are InnoDB versus MyISAM, and the size of each, gives us a clear map of where to apply optimization steps.
We start with phpMyAdmin for a visual approach. After logging in, we select the Joomla database, tick all tables, and from the “With with dropdown choose Repair table. This runs REPAIR TABLE on each one. For a command‑line workflow, we log into the server and execute:
mysql -u joomla_user -p -e "USE joomla_db; SHOW TABLES;" | while read tbl; do
  mysql -u joomla_user -p -e "OPTIMIZE TABLE \\\`$tbl\\\`;";
done
The OPTIMIZE TABLE command rebuilds the table and updates index statistics. In InnoDB, it also defragments the data file. After running the commands, we check the table status with SHOW TABLE STATUS\ where the Data_free column should be close to zero. For large tables we can run ANALYZE TABLE` to refresh the optimizer’s statistics, which helps the query planner choose the best index. Regularly repairing and optimizing tables reduces I/O and speeds up Joomla’s core queries.
The #__session table can accumulate millions of rows if the site experiences spikes. We can safely truncate it during low‑traffic periods:
TRUNCATE TABLE `#__session`;
Similarly, the #__action_logs table stores every admin action. For sites that do not need a detailed audit trail, we can purge entries older than 30 days:
DELETE FROM `#__action_logs` WHERE `created_at` < NOW() - INTERVAL 30 DAY;
After cleaning, we run OPTIMIZE TABLE on the affected tables to reclaim space. Reducing the size of these tables cuts the time Joomla spends scanning them during each request, especially for logged‑in users who trigger session reads on every page load.
Joomla’s default schema includes indexes on primary keys and a few foreign keys, but custom queries often lack optimal indexing. We start by enabling the slow query log:
[mysqld]
slow_query_log = 1
slow_query_log_file = /var/log/mysql/slow.log
long_query_time = 0.5
After a day of traffic, we review the log for queries that exceed 0.5 seconds. A common culprit is a query that joins #__content with #__categories without an index on catid. We can add an index with:
ALTER TABLE `#__content` ADD INDEX `idx_catid` (`catid`);
For the #__extensions table, an index on type and folder speeds up plugin loading:
ALTER TABLE `#__extensions` ADD INDEX `idx_type_folder` (`type`, `folder`);
After adding indexes, we re‑run the slow query log and verify that the same queries now finish in under 0.1 seconds. Proper indexing is often the single biggest gain we can achieve on a Joomla site.

PHP 8.1, 8.2, and the newly released 8.3 bring substantial speed improvements over the legacy 7.4 line. Benchmarks from the Joomla community show a 20 % reduction in execution time for the same request when moving from 7.4 to 8.2. The Just‑In‑Time (JIT) compiler in PHP 8.2 can accelerate numeric loops used by extensions that process large data sets. We recommend running php -v to confirm the version and, if possible, upgrading to the latest stable 8.x release. On a typical shared host, the upgrade may require a control‑panel switch; on a VPS or dedicated server we can install the newer package and point the web server to the new binary.
OPcache stores compiled PHP bytecode in shared memory, eliminating the need to re‑parse scripts on each request. The default settings are conservative. We adjust the php.ini file as follows:
[opcache]
opcache.enable=1
opcache.memory_consumption=256
opcache.interned_strings_buffer=16
opcache.max_accelerated_files=10000
opcache.revalidate_freq=60
opcache.validate_timestamps=1
opcache.fast_shutdown=1
After editing php.ini, we restart PHP‑FPM or Apache:
systemctl restart php8.2-fpm
# or
service apache2 restart
Monitoring opcache_get_status() via a simple script confirms that the cache hit rate stays above 95 % on a busy Joomla site.
Joomla’s core and many extensions rely on generous PHP memory limits. The default memory_limit of 128 M can cause “Allowed memory size exhausted” errors on large sites. We raise it to 512 M:
memory_limit = 512M
The max_execution_time controls how long a script may run before PHP aborts. For Joomla pages that generate PDFs or perform batch imports, a limit of 300 seconds is safe:
max_execution_time = 300
We also increase post_max_size and upload_max_filesize to accommodate large media uploads:
post_max_size = 64M
upload_max_filesize = 64M
These values are reflected in the phpinfo() output, and they prevent timeouts during heavy admin tasks.

All three servers can host Joomla, but they differ in how they handle static assets and PHP processing.
We typically start with Nginx on a VPS because its event‑driven architecture scales well. For shared hosting where only Apache is available, we enable mod_deflate and Expires headers to compensate.
Compressing HTML, CSS, and JavaScript reduces payload size dramatically. In Apache we enable mod_deflate with the following .htaccess snippet:
<IfModule mod_deflate.c>
    AddOutputFilterByType DEFLATE text/html text/css application/javascript application/json
    # Exclude already compressed assets
    SetEnvIfNoCase Request_URI \.(?:gif|jpe?g|png|zip|gz|rar|pdf)$ no-gzip dont-vary
    Header append Vary User-Agent env=!no-gzip
</IfModule>
For Nginx the equivalent directive is:
gzip on;
gzip_types text/css application/javascript text/html application/json;
gzip_vary on;
gzip_min_length 256;
After enabling compression, we test with curl -I -H "Accept-Encoding: gzip" https://example.com and verify that the Content-Encoding: gzip header appears. Typical compression ratios for Joomla pages are 60‑70 %, cutting the download size from 1.2 MB to under 500 KB.
Setting long‑term caching for static assets prevents the browser from re‑downloading them on each visit. For a deeper look at .htaccess rules, check our Joomla .htaccess security and performance guide. In .htaccess we add:
<IfModule mod_expires.c>
    ExpiresActive On
    ExpiresDefault "access plus 1 month"
    ExpiresByType image/jpeg "access plus 1 year"
    ExpiresByType image/png  "access plus 1 year"
    ExpiresByType text/css   "access plus 1 month"
    ExpiresByType application/javascript "access plus 1 month"
</IfModule>
For Nginx:
location ~* \.(?:css|js|png|jpg|jpeg|gif|svg|webp)$ {
    expires 1y;
    add_header Cache-Control "public, immutable";
}
These headers tell the browser to keep the files for up to a year, dramatically reducing repeat‑visit load times. We verify the headers with curl -I and look for Expires and Cache‑Control.
HTTP/2 multiplexes multiple requests over a single TLS connection (which requires an SSL certificate setup), cutting round‑trip overhead. Most modern browsers support it, and web servers enable it automatically when TLS is active. In Apache we add:
Protocols h2 http/1.1
In Nginx:
listen 443 ssl http2;
After enabling, we run a Lighthouse audit and see the “Uses HTTP/2” flag turn green. The reduction in TTFB can be as much as 120 ms on a Joomla page that loads dozens of CSS/JS files.

Joomla offers two primary caching layers. We covered the fundamentals in our Joomla caching configuration guide. System cache stores the output of PHP functions and database queries in the file system or Redis. It is useful for reducing the cost of repeated API calls or heavy calculations. Page cache stores the fully rendered HTML of a page, bypassing PHP execution for anonymous visitors. When we enable page cache, Joomla writes a static HTML file to the cache folder and serves it directly for subsequent requests. The system cache is still active for logged‑in users, while page cache is only used for guests. Understanding the distinction helps us decide which layer to prioritize based on traffic patterns.
Log in to the Joomla administrator panel.
Go to to **System → Global Configuration → System**.
Set **Cache** to **ON – Conservative** for a balanced approach, or **ON – Progressive** if the site is mostly static.
Choose **Cache Handler** – we recommend **File** for simplicity or **Redis** for high‑traffic sites.
Set **Cache Time** to **900** seconds (15 minutes) as a starting point.
Save the configuration.
Next, we enable the System – Page Cache plugin:
After saving, we clear the cache via System → Clear Cache and test the site with a private browsing window to confirm that the cached HTML is served (look for the X-Cache header).
Conservative caching stores the rendered page for each menu item but respects module parameters that differ per user group. It works well for sites where most visitors are guests but some modules (e.g., login forms) need to stay dynamic. Progressive caching serves the same cached page to every visitor, ignoring module variations. This yields the highest hit rate but can expose personal data if a module displays user‑specific information. We typically start with Conservative mode, monitor the cache hit ratio, and switch to Progressive only after confirming that no personalized modules are present on the cached pages.

We begin by listing all enabled extensions from the database:
SELECT `type`, `folder`, `element`, `enabled` FROM `#__extensions` WHERE `enabled` = 1;
Next, we use the Joomla Debug System (enable System → Debug System) to capture the execution time of each plugin during a page load. Plugins that consistently add more than 50 ms are flagged for review. Common offenders include social‑share widgets, SEO add‑ons that generate meta tags on every request, and heavy image galleries that load full‑size images by default. We either replace them with lighter alternatives or configure them to load only on specific pages using the “Assignment” tab in the plugin settings.
JCH Optimize aggregates and minifies CSS/JS files, reducing HTTP requests and payload size. To configure it:
Install the JCH Optimize component from the Joomla Extension Directory.
Go to **Components → JCH Optimize → Settings**.
Enable **Combine CSS Files** and **Combine JavaScript Files**.
Turn on **Minify CSS** and **Minify JavaScript**.
Set **Exclude Files** for any library that must remain uncompressed (e.g., certain admin scripts).
After saving, we clear the Joomla cache and run a page speed test. Typical results show a 30 % reduction in total page size and a 0.4 second improvement in LCP.
Large images dominate the payload of Joomla articles. We convert JPEG/PNG files to WebP using the cwebp command:
cwebp -q 80 image.jpg -o image.webp
We then replace the image source in the article with the WebP version. For lazy loading, Joomla 4 includes native support via the loading="lazy" attribute. We enable it globally by adding a small JavaScript snippet in the template’s index.php:
<script>
document.addEventListener('DOMContentLoaded', function () {
    const imgs = document.querySelectorAll('img');
    imgs.forEach(img => img.setAttribute('loading', 'lazy'));
});
</script>
The combination of WebP conversion and lazy loading cuts the initial download size by up to 55 % and improves LCP on mobile devices.
Before making any changes, we capture a baseline using three free tools:
We record the following metrics (our Joomla speed optimization guide covers the full testing workflow): TTFB, LCP, total page weight, number of requests, and the OPcache hit rate. For example, a typical baseline might show a TTFB of 340 ms, LCP of 3.2 seconds, and a total size of 1.8 MB. These numbers become our reference point for future comparisons.
Regular maintenance keeps the database lean. We create a cron entry that runs nightly at 02:00 AM:
0 2 * * * /usr/bin/php /path/to/joomla/cli/maintenance.php --optimize --repair >> /var/log/joomla/maintenance.log 2>&1
The maintenance.php script contains:
<?php
define('_JEXEC', 1);
require_once __DIR__ . '/defines.php';
require_once JPATH_BASE . '/includes/framework.php';
$app = JFactory::getApplication('site');
$db = JFactory::getDbo();
$tables = $db->getTableList();
foreach ($tables as $table) {
    $db->setQuery("OPTIMIZE TABLE `$table`");
    $db->execute();
    $db->setQuery("REPAIR TABLE `$table`");
    $db->execute();
}
echo "Database maintenance completed at " . date('c') . PHP_EOL;
?>
The script iterates over every table, runs OPTIMIZE and REPAIR, and logs the outcome. By automating this task, we prevent table fragmentation without manual intervention.
We integrate a lightweight JavaScript library that sends Web Vitals to a custom endpoint:
<script src="https://unpkg.com/web-vitals@2/dist/web-vitals.umd.js"></script>
<script>
import {getCLS, getFID, getLCP} from 'web-vitals';
function sendToAnalytics(metric) {
    fetch('/metrics.php', {
        method: 'POST',
        body: JSON.stringify(metric),
        keep: {'Content-Type': 'application/json'}
    });
}
getCLS(sendToAnalytics);
getFID(sendToAnalytics);
getLCP(sendToAnalytics);
</script>
The metrics.php endpoint stores the data in a MySQL table for later analysis. By reviewing trends weekly, we can spot regressions caused by new extensions or server updates and act before they affect rankings.
1. How do I check my Joomla site’s performance?
We use a combination of GTmetrix, PageSpeed Insights, and WebPageTest to capture TTFB, LCP, total page weight, and request count. Additionally, we enable Joomla’s Debug System to view PHP execution time and database query statistics directly in the admin panel.
2. What is the best caching method for Joomla?
For most sites, enabling System – Page Cache (see also our Joomla CDN setup guide) with the Conservative mode provides a solid balance between speed and dynamic content. Pair this with a file‑based system cache or Redis for backend queries, and you’ll see a 30‑40 % reduction in load time.
3. Does the PHP version affect Joomla speed?
Yes. PHP 8.x introduces a JIT compiler and many engine optimizations that can cut execution time by 15‑25 % compared to PHP 7.4. Upgrading to the latest stable 8.x release is one of the quickest ways to boost Joomla performance.
4. How often should I optimize my Joomla database?
We recommend running a full OPTIMIZE TABLE and REPAIR TABLE cycle at least once a month, and more frequently (weekly) on high‑traffic sites. Automating the process with a cron job ensures the database stays lean without manual effort.
5. Can too many extensions slow down Joomla?
Absolutely. Each enabled extension adds PHP execution time and may introduce additional database queries. Regularly audit extensions, disable any that are not essential, and monitor their impact with Joomla’s Debug System to keep the site responsive.